What's the difference between App Store conversion rate and install rate
If you're digging into your mobile app installation numbers, you probably ran across 2 terms that may sound similar: conversion rate and install rate.
There are 2 types of flows leading app store visitors to install your app:
- Visitors land straight on your app's Product Page (that's where all the details and images are), after clicking a referral link, or an ad. They explore the app details and some of them install it.
- Visitors run across your app in one of the store lists (in search results, or while browsing categories) and decides to install it without even getting to the product page. This scenario is currently only available in Apple's App Store.
Conversion rates (CVR)
CVR Definition: the percentage of users who download your app from within the product page. That's scenario 1.
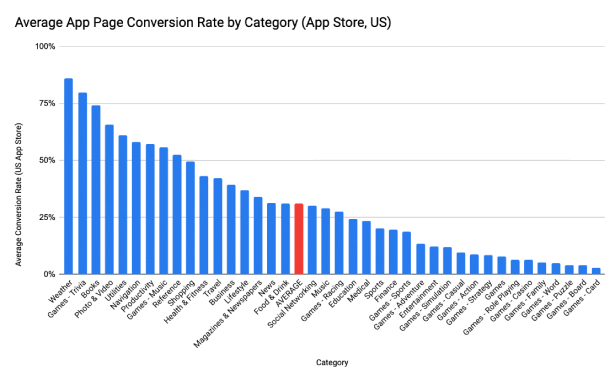
According to AppTweak, the average conversion rate in the US App Store is 31%, ranging from 80% in some app categories (i.e weather, and trivia apps) all the way down to 4% in other categories (i.e. puzzle and card games). Google Play apps are doing slightly better with an average of 32.7%.
Here are some benchmarks:
Conversion rates can be optimized - see my guide on optimizing the product page - it's not new, but most of it is relevant in 2023.
Install Rate
Definition: the percentage of store visitors who download your app after seeing it elsewhere in the store (free browsing, search results, similar apps, etc.). That's scenario 2.
Install rates are harder to trick, as the flow has fewer elements and hooks to optimize. Therefore the numbers are much smaller:
According to AppTweak, the average install rate in the US App Store is 4%, ranging from 10% in some app categories (i.e travel, and navigation apps) all the way down to less than 1% in other categories (mainly games).
Here are some benchmarks:
You might also like:
Forms completion rates - statistics, insights, and takeaways
4 Reasons why mobile ad attribution numbers never match up
The all-in-one guide to high-converting CTA buttons
Cohort analysis - 4 ways to analyze your product retention rate
Before you drop off, subscribe to my occasional newsletter (I'm too lazy to spam) and become 23% more awesome than average.


Comments
Post a Comment